Making it easier and quicker for employees & partners to utilise data
The 8-week discovery phase focused on identifying opportunities to streamline data-sharing processes for Compare the Market's (CtM) partners, enable self-service data access to reduce manual intervention, and improve reporting capabilities to enhance data accuracy and performance insights.
Compare the Market
User research, ideation, workshop facilitation, storyboarding, concept design
Insurance & Finance
UX Designer (me), UI designer, Tech Lead, QA, Product Manager, Delivery Lead
Challenge
Internal Compare the Market teams were overwhelmed with custom data requests from partners and spent significant time generating reports. Additionally, most internal teams—except for the data team—lacked direct access to key data points within Compare the Market’s internal tools, such as Power BI.
The entire data exchange process, along with how partners accessed and interacted with data, needed a complete overhaul to better support both internal teams and external partners.
Opportunity
We needed to discover how Compare the Market could not only streamline data access and exchange for its partners, but also position itself as a best-in-class as a price comparison platform for partners.
Results
Through user research, we were able to identify where the process was failing, and where we could immediately improve the current process.
We interviewed partners, and were able to identify a data wish list and key pain points for improvement. By identifying which data points partners needed access to and our tech team enabling access, we managed to increase partner data access.
Created design artefacts for long term strategies of the project.
300%
Increase in partner data access
90%
Increase in self generated reports
4 hrs/day
Reduced reporting time
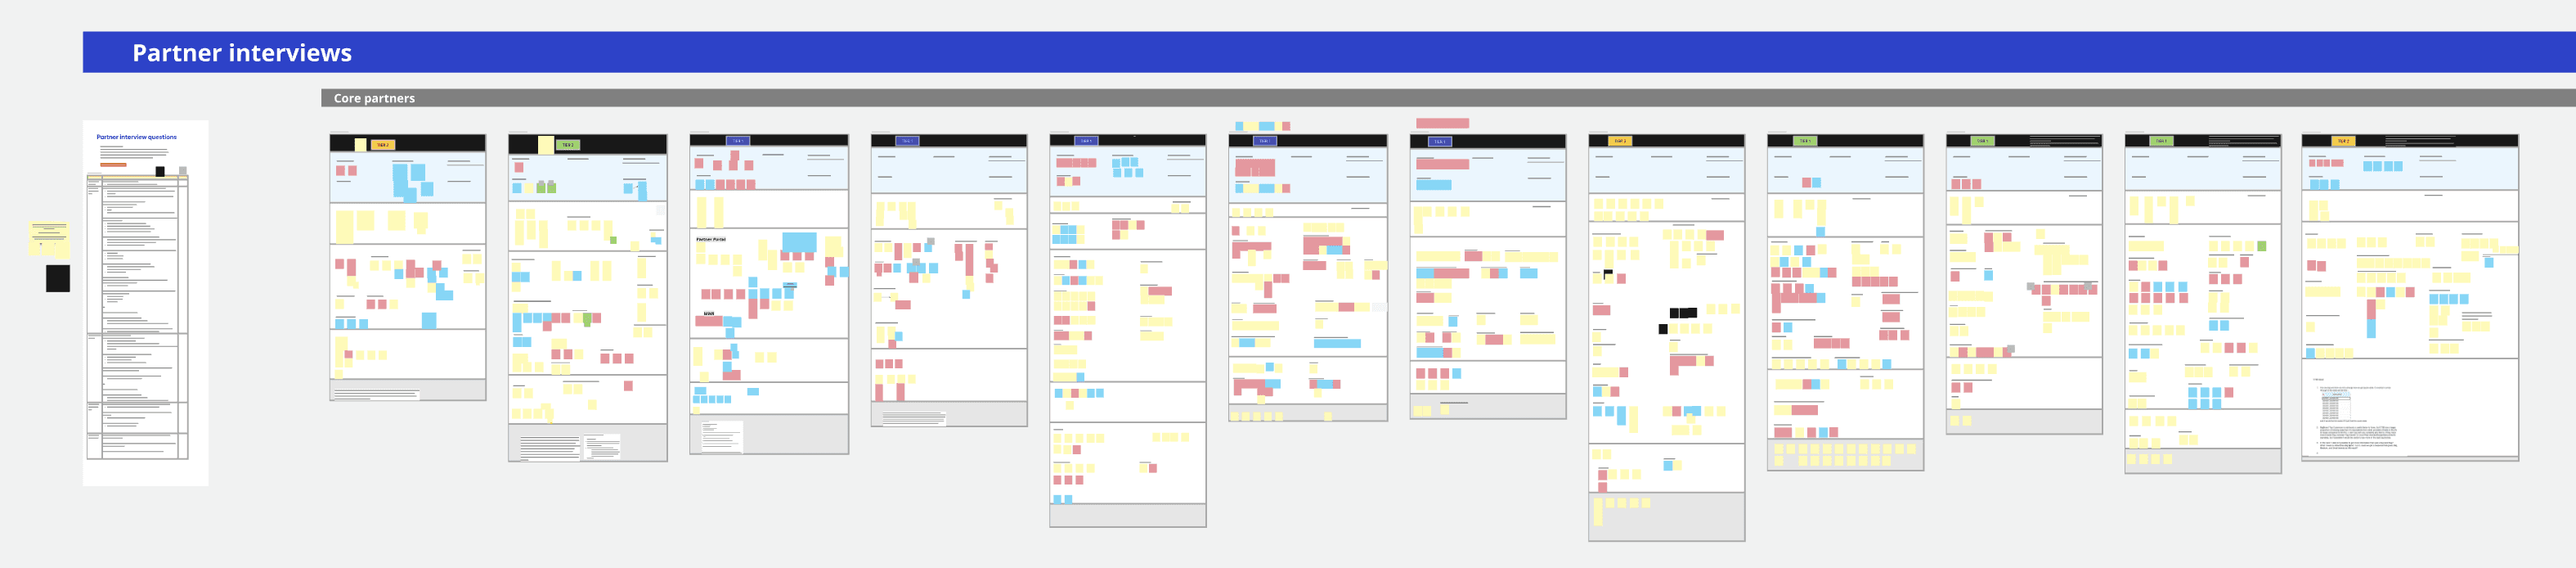
Partner interviews findings
"CTM's data comes in later than other price comparison websites, sometimes as late as lunchtime....Without CTM's data-given its significant market share-the report is unreliable."

Quote from Partner Interview
-Compare the Market Partner
All partners expressed frustration with delays in daily portal data updates and the slow processing of custom data requests. This has a negative impact on their reporting, and there is a perception that CtM doesn't have enough capacity or capability to service their requests.
Partners are frustrated with the format of the data provisions they receive - for example they prefer a single, consolidated file rather than separate files for individual brands would streamline their workflow and reduce complexity.
All partners are seeking more behavioural, demographic, and benchmarking data from CTM, as competing PCWs already offer this insight. This information would help them with their strategic decision-making and market positioning.
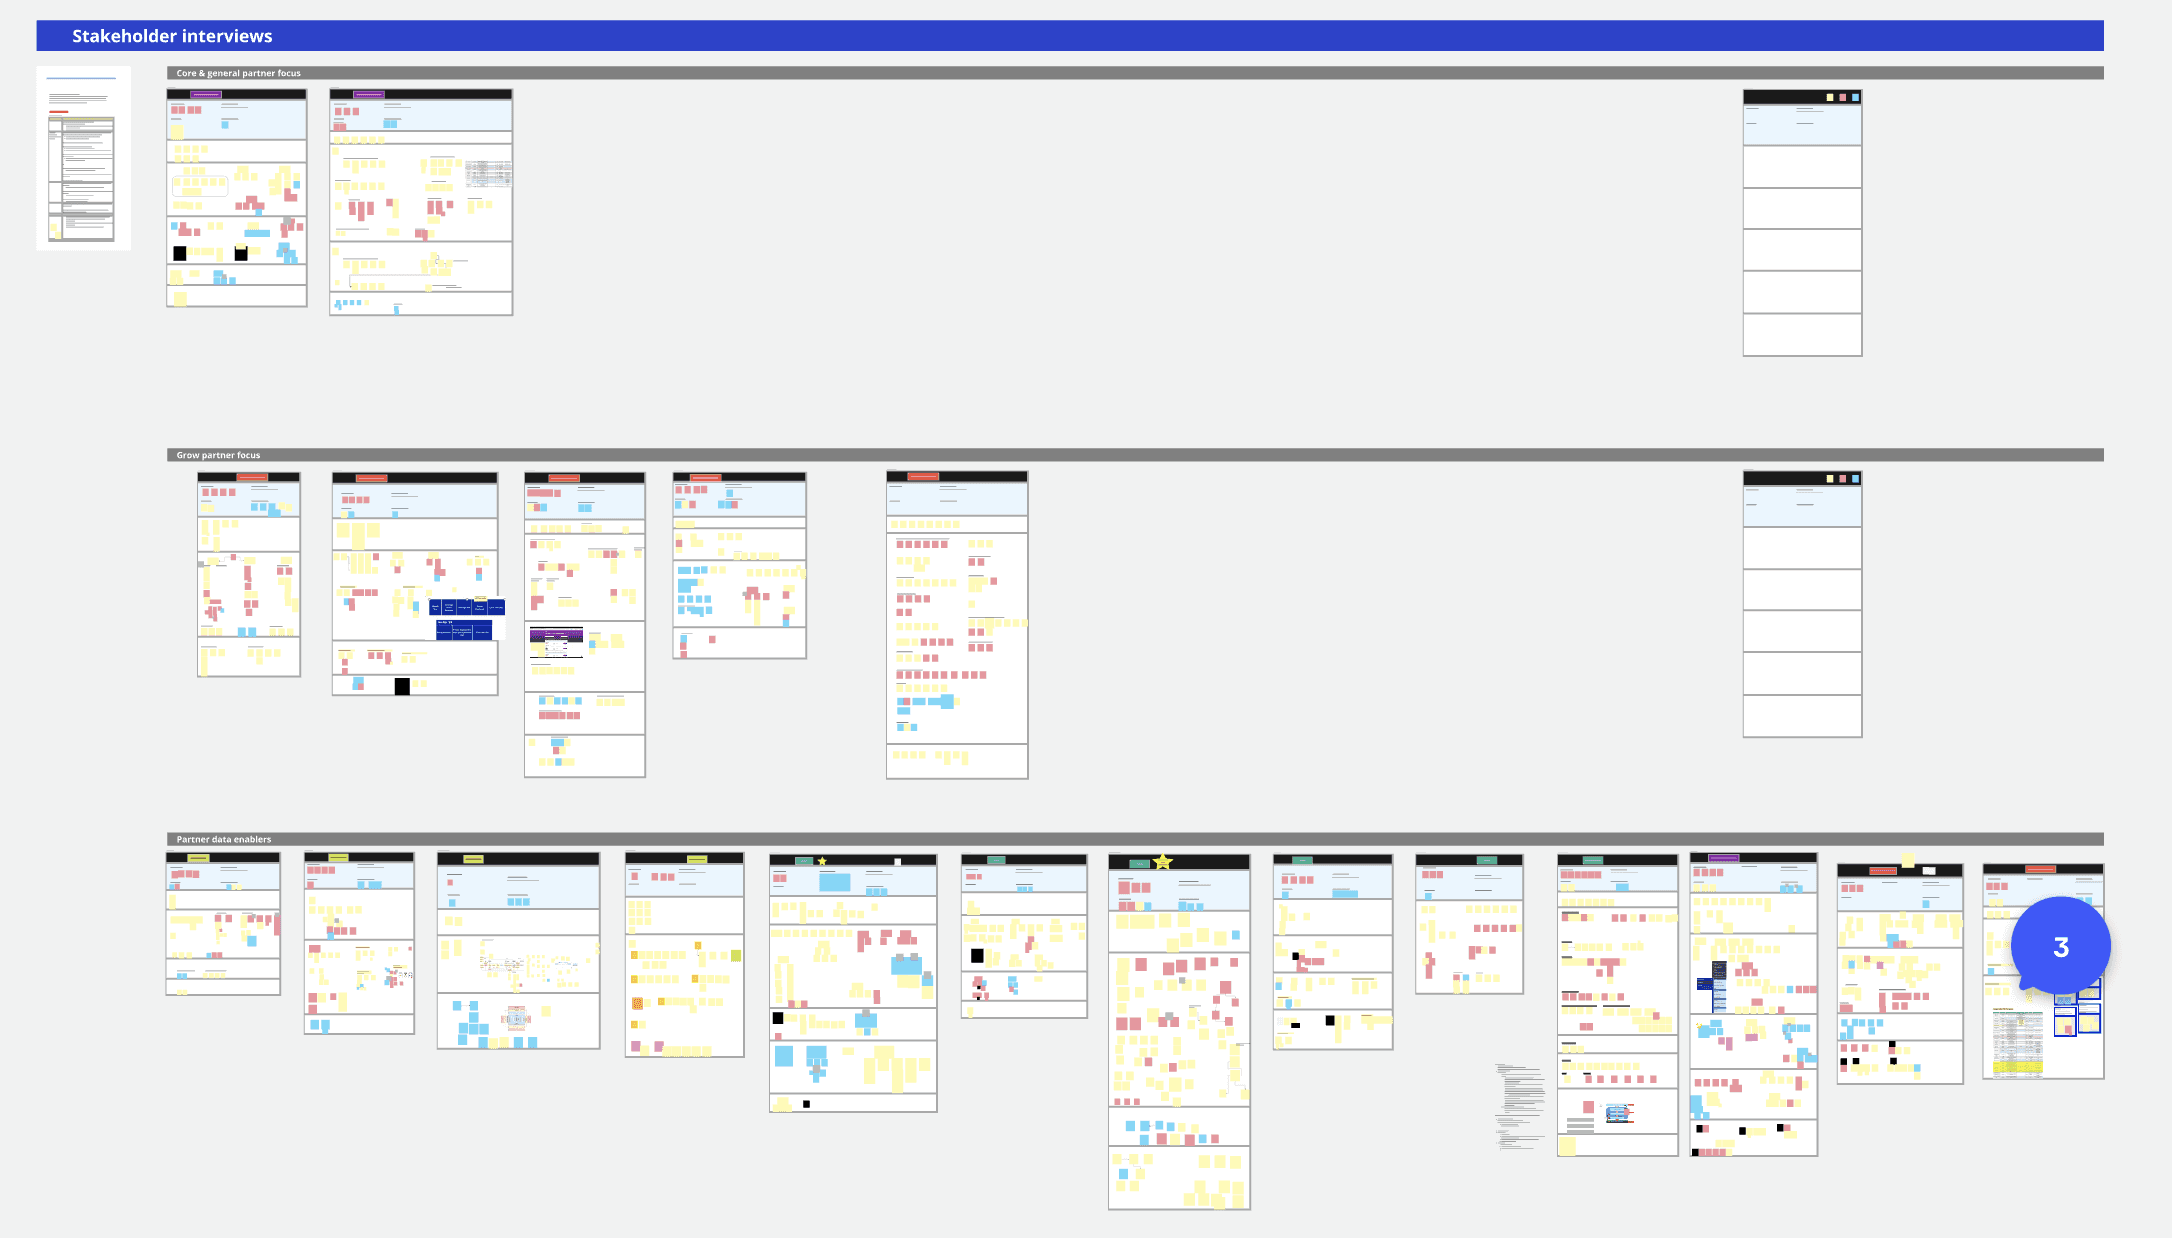
Stakeholder interviews findings
"If we had more data on the Partner Portal for partners to access, it would save an email into our inbox, it would save us from having to do lengthy ad hoc requests, it would help save us and them time."

Quote from Stakeholder Interview
-Compare the Market Internal Stakeholder
Commercial managers struggle with the amount of manual intervention needed to serve partners the data they need - often they feel that this data could just be part of the Power Bl Partner Portal instead.
Stakeholders are aware that partners have varying levels of technical capability so any proposed solution(s) would "need to meet the partners where they are today'.
There's an underlying theme of CtM having no insight into the questions that partners are asking of the data in the first place, so designing robust and scalable data solutions is difficult.
Addressing short term solutions and getting BIG WINS!
From the interviews, we were able to identify pain points that could be addressed straight away. It was clear that both partners and internal stakeholders immediately needed access to more data points in Power BI.
Combing through the interviews, we identified a "data wish list", and additionally sent out a survey to partners to understand exactly which additional data points they needed access to in Power BI. which was presented to internal tech teams for feasibility in introducing these data points. They were released in Power BI, and the results were astounding! Partners had an increase of data by 300%! Internal teams saw an increase of 90% of reports being self generated. Both results were huge wins!
Another major pain point uncovered in the partner interviews was that partners were getting their daily data reports as late as lunchtime. This really affected their reporting to senior stakeholders within their own businesses, as top level execs often expected the reports before lunchtime. When probed on when they would prefer to receive their daily reports, partners mentioned that competitors normally gave daily updates first thing in the morning (around 8 AM).
We flagged this, and within a week, CtM's tech teams were able release daily reports at 8 AM, meaning a 4 hour reduction in reporting was achieved. Partners were over the moon with the change in reporting time! Another win!
Continuing the Discovery for long term solutions
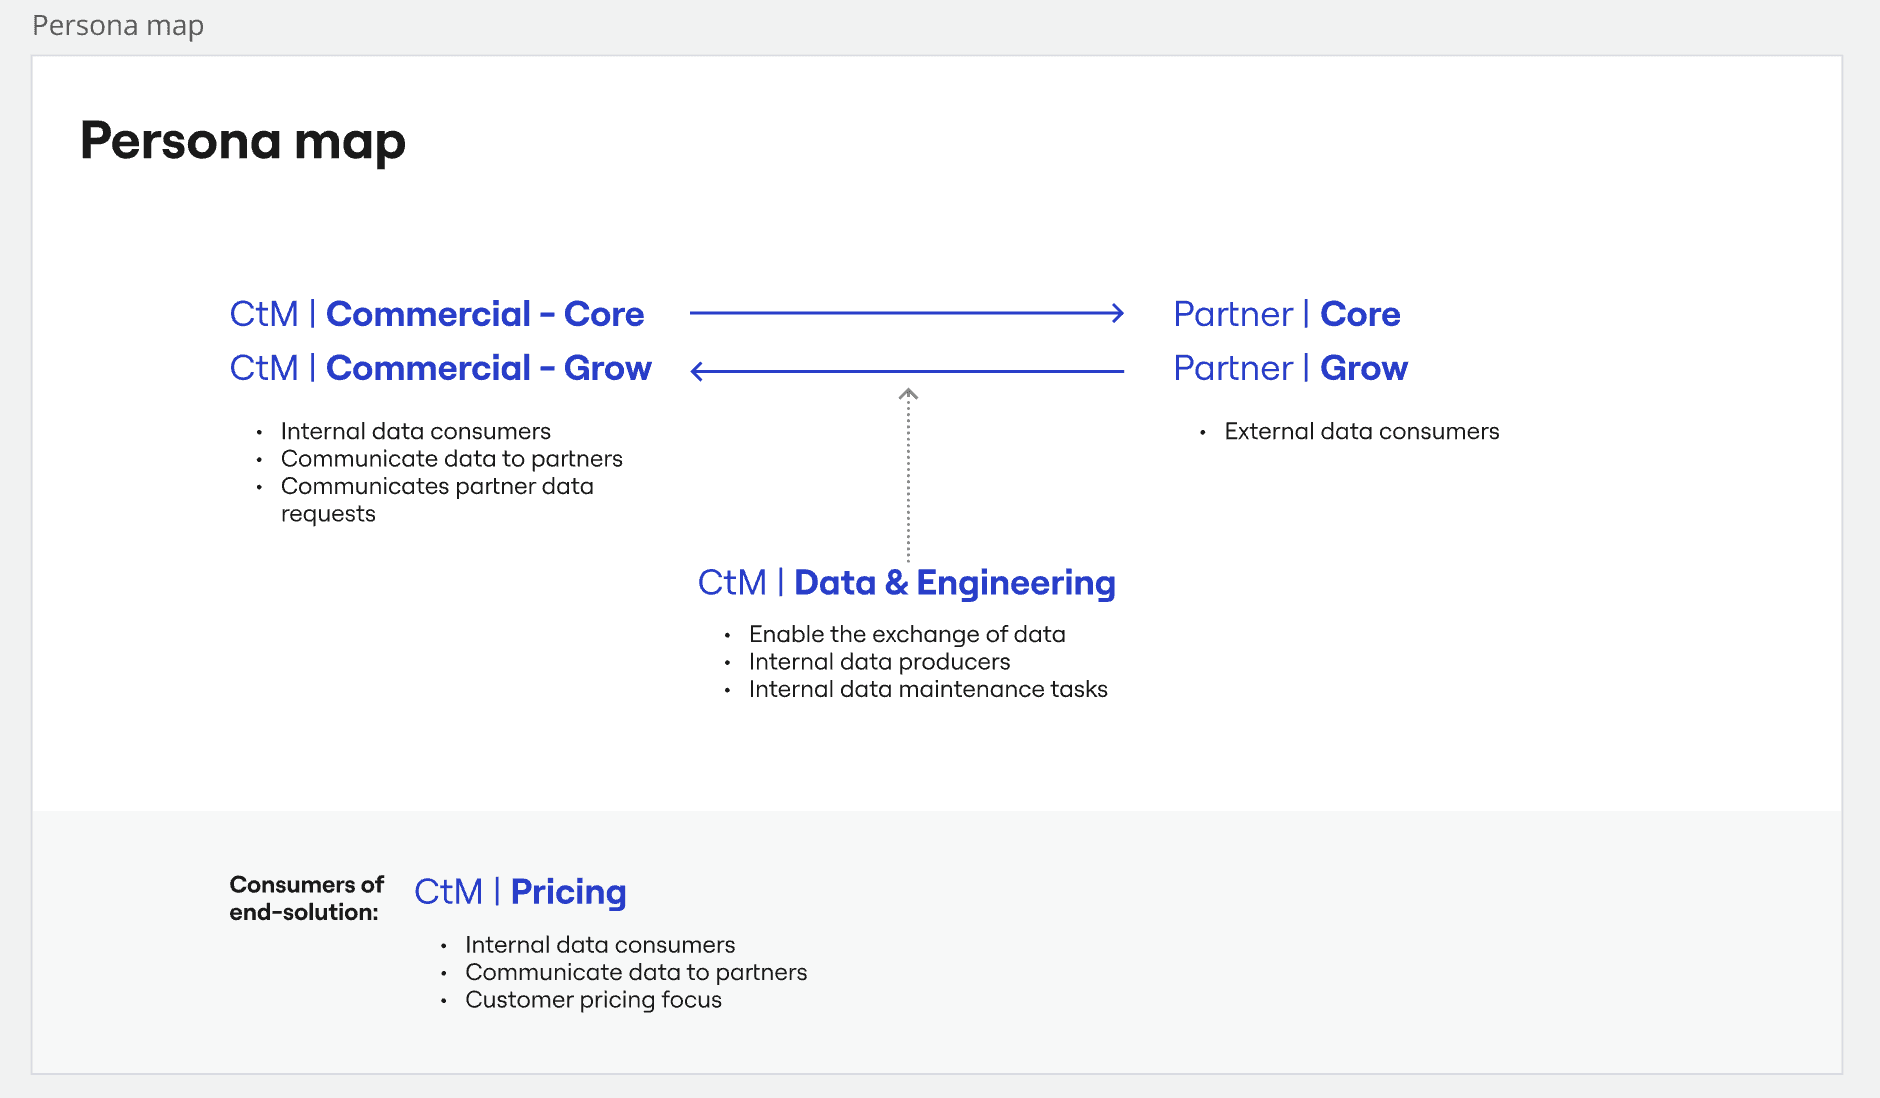
Persona creation
Based on insights gathered from partner and stakeholder interviews, we identified three key personas. These personas served as a foundation for our design decisions, ensuring alignment with user needs and expectations throughout the project. This approach helped us create a more user-centric experience while maintaining strategic alignment with business objectives.
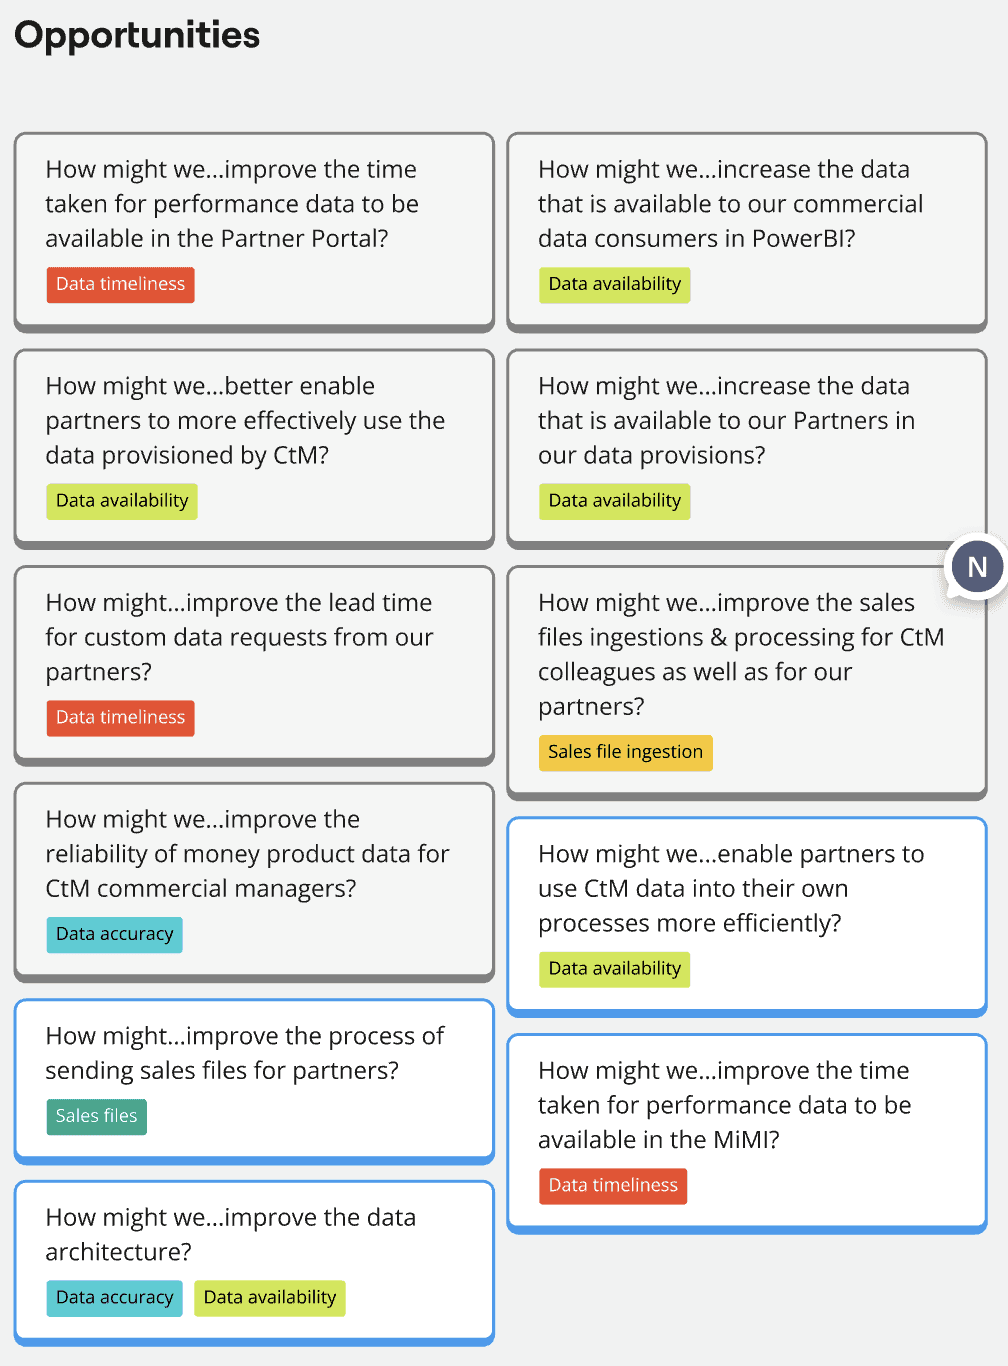
Identifying opportunities
After analyzing the interview data, we distilled key insights and pain points, then reframed them into "How might we" questions. This approach allowed us to turn challenges into opportunities, fostering a more solution-oriented design process.
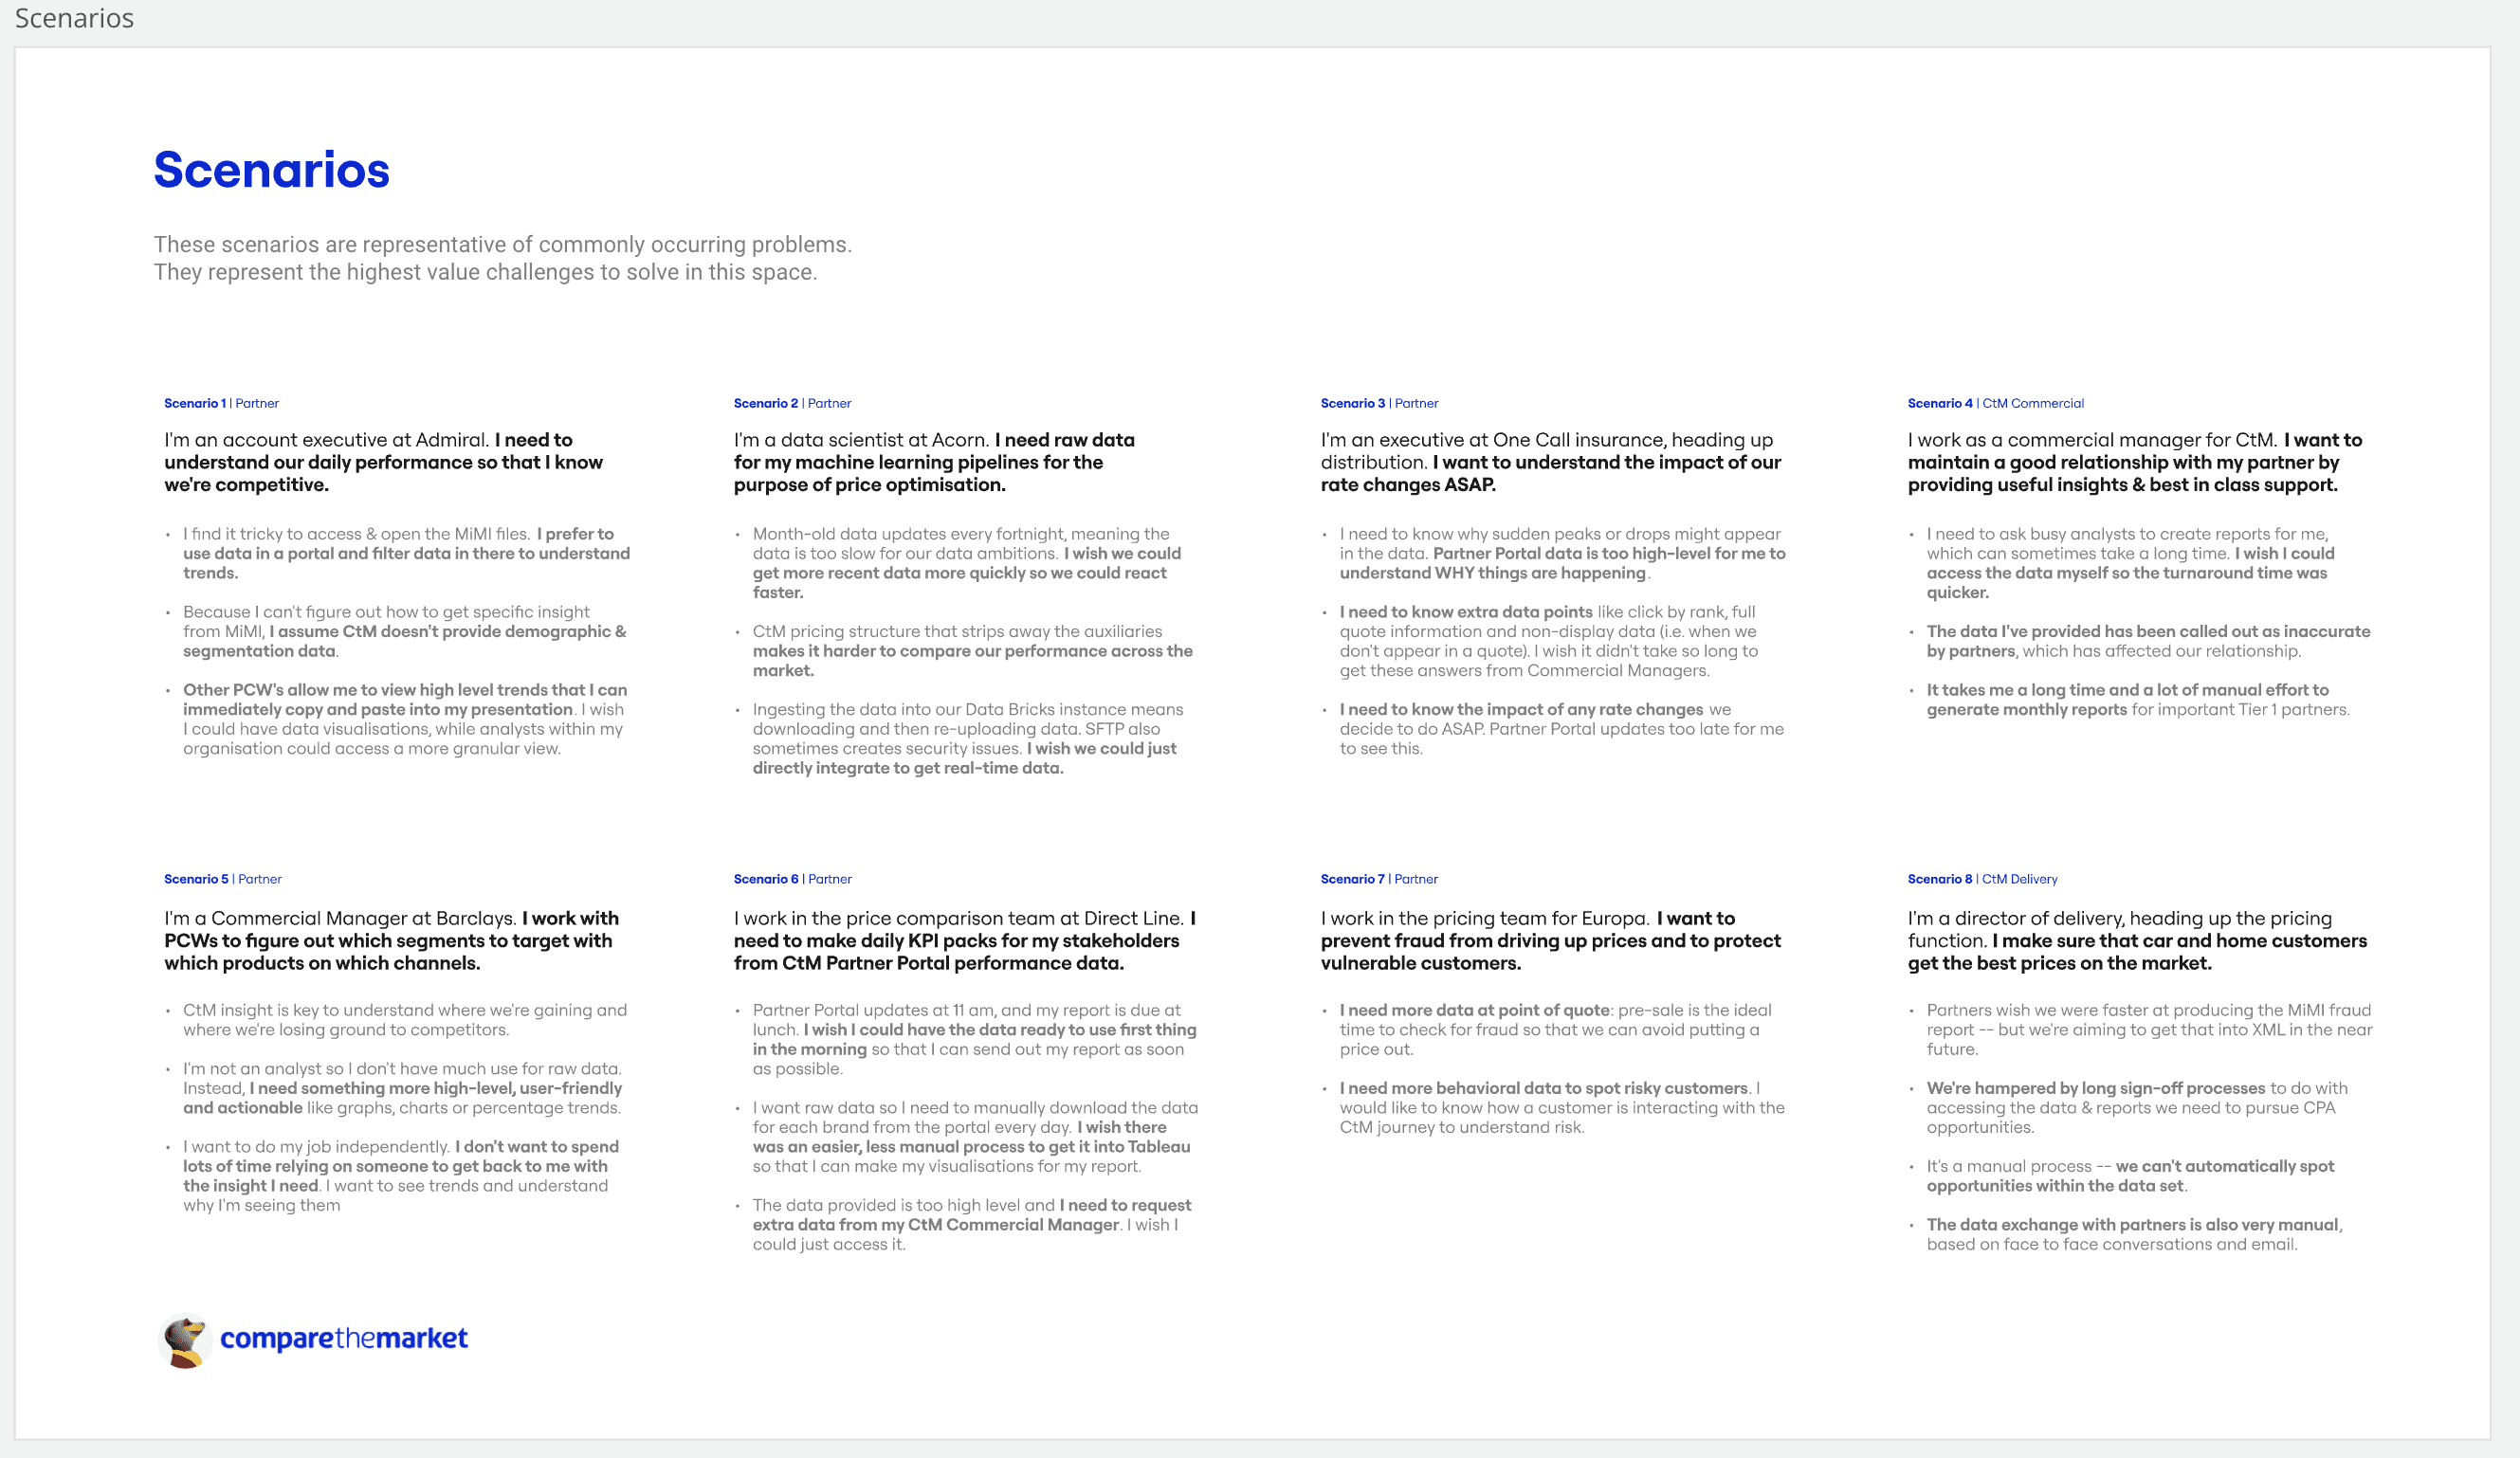
Ideation through scenarios
We wrote various scenarios based off 2 personas to represent common problems that partners and the commercial team face.
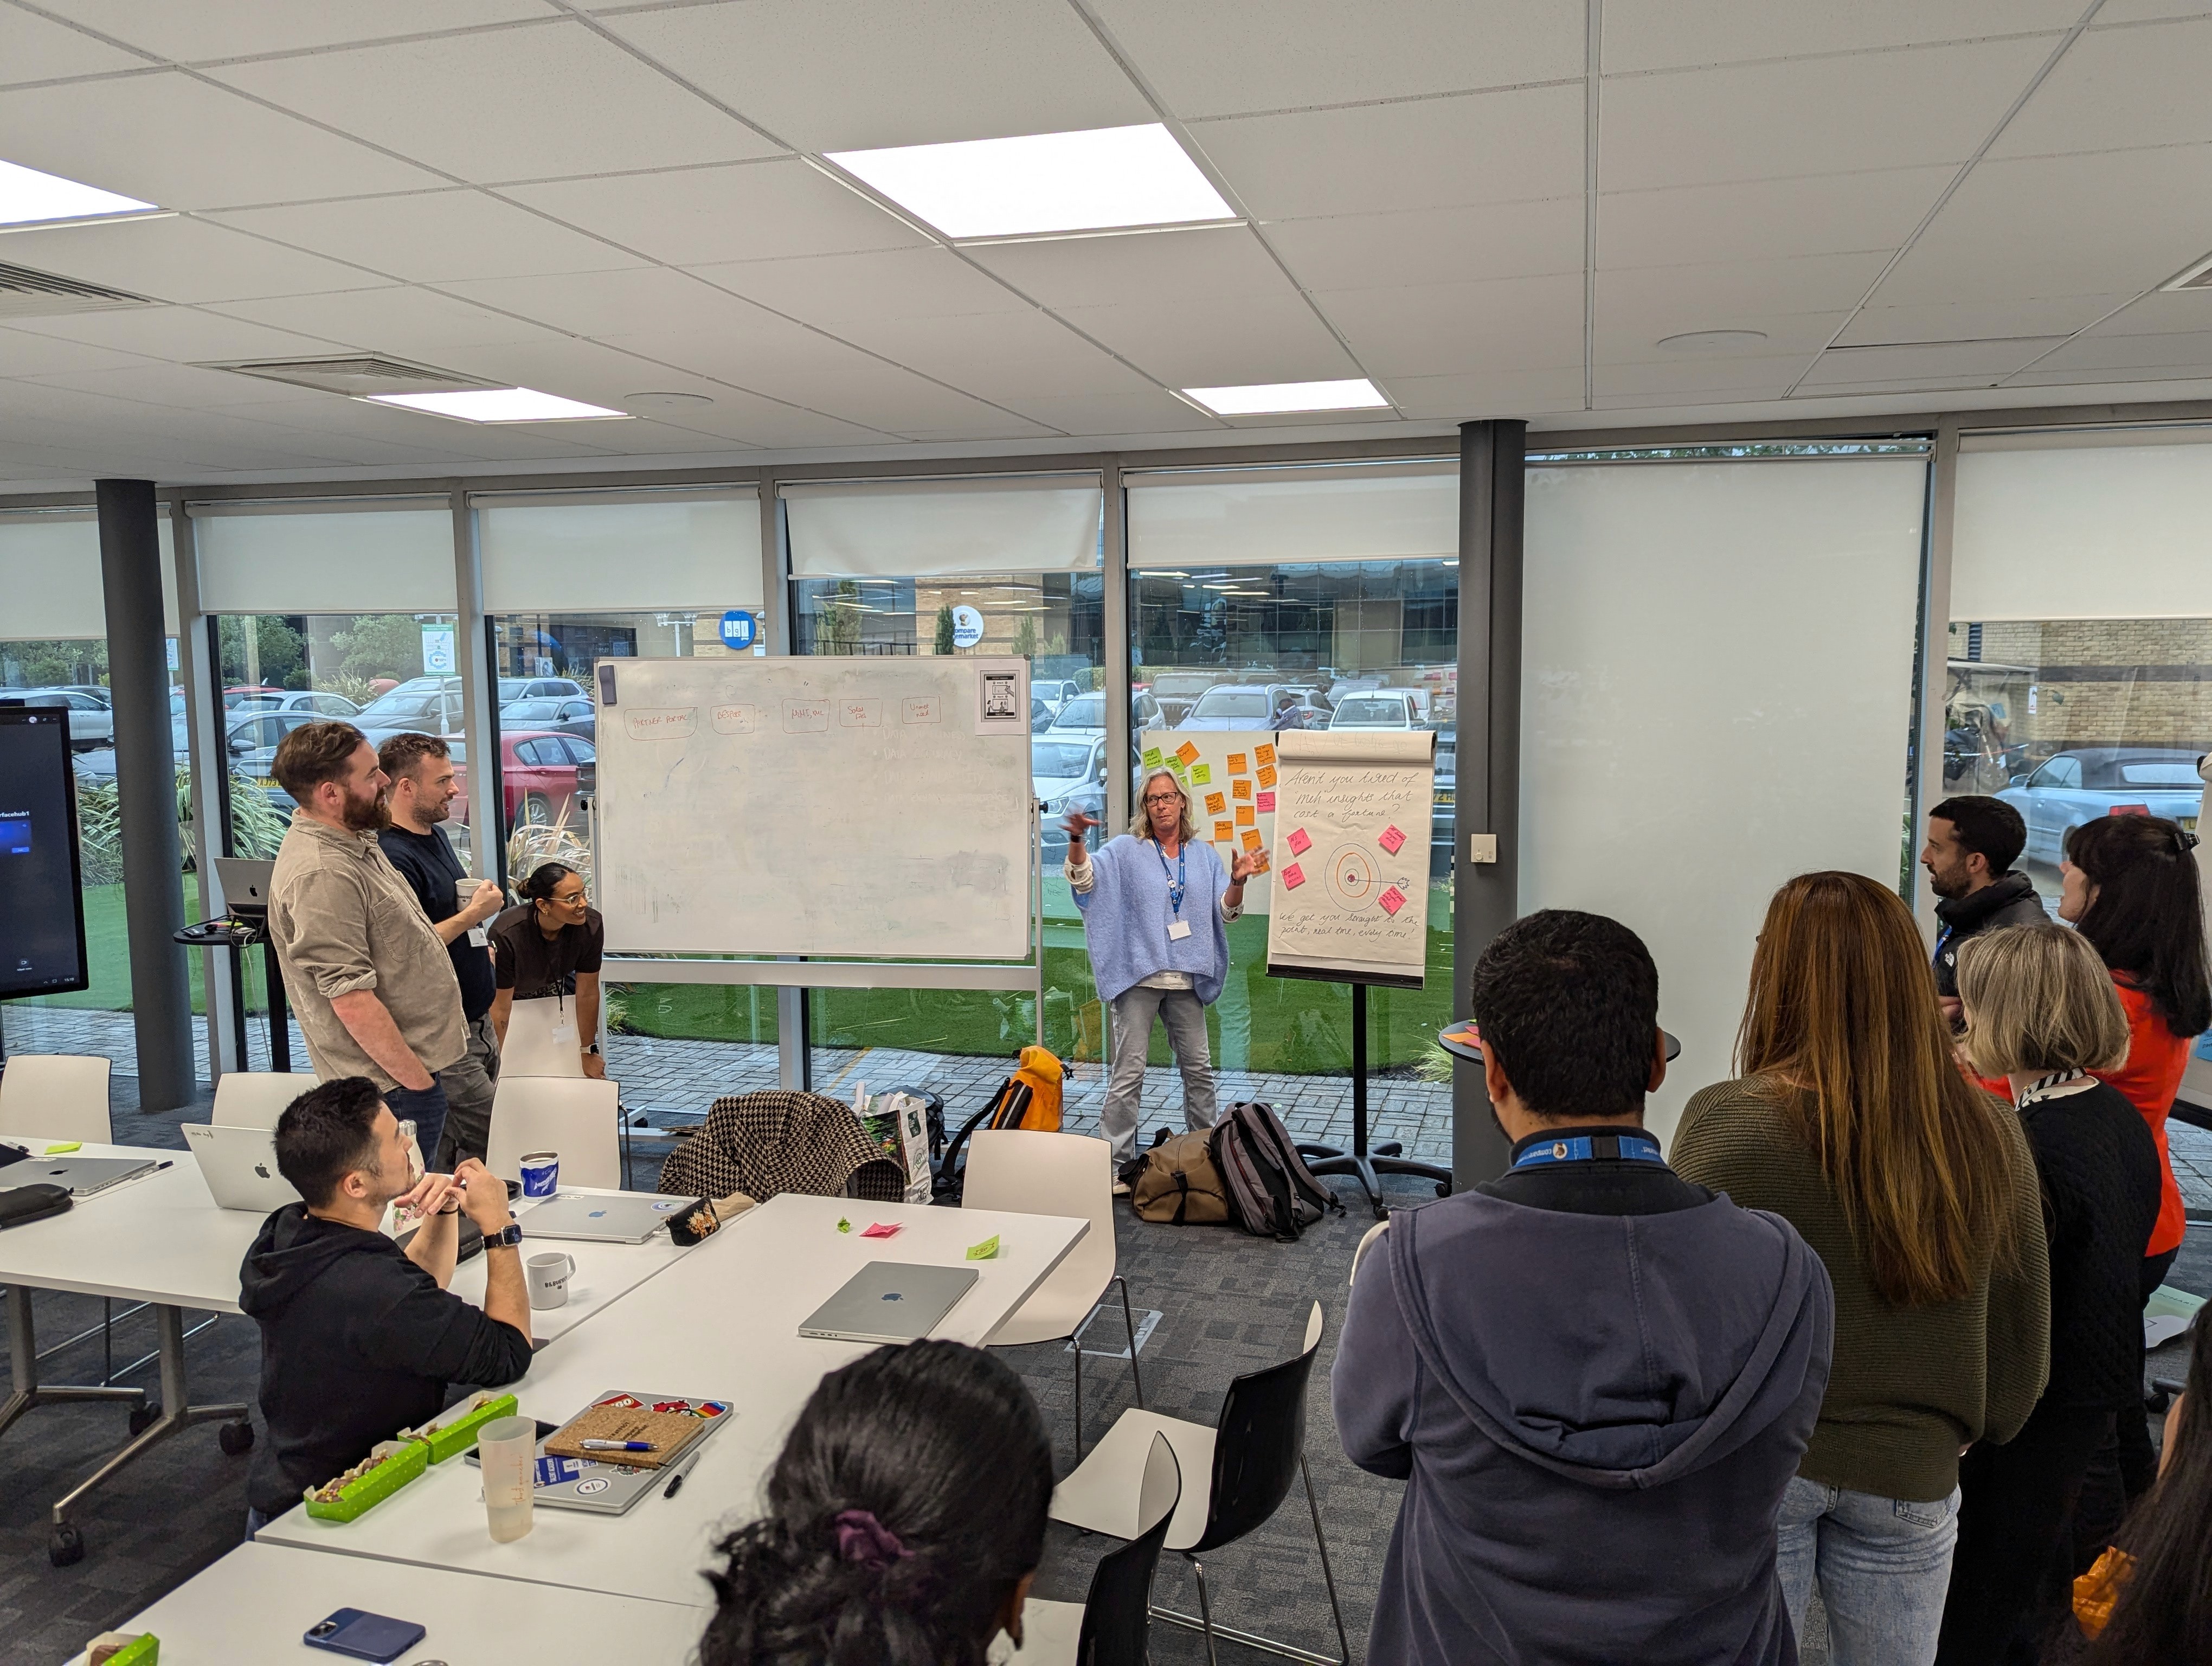
Crazy 8 Workshop
To generate ideas that effectively addressed our key persona's needs and goals, we organised an ideation workshop and invited key stakeholders from across CtM to collaborate. The attendees brought a wealth of diverse insights to the session, drawn from their hands-on experience working with various data provisions, partners, and their in-depth understanding of the data. During the workshop, several prominent themes began to surface. When we categorised the ideas, we discovered significant overlap in innovative suggestions and shared visions for enhancing the user experience, highlighting a collective drive toward meaningful improvements.
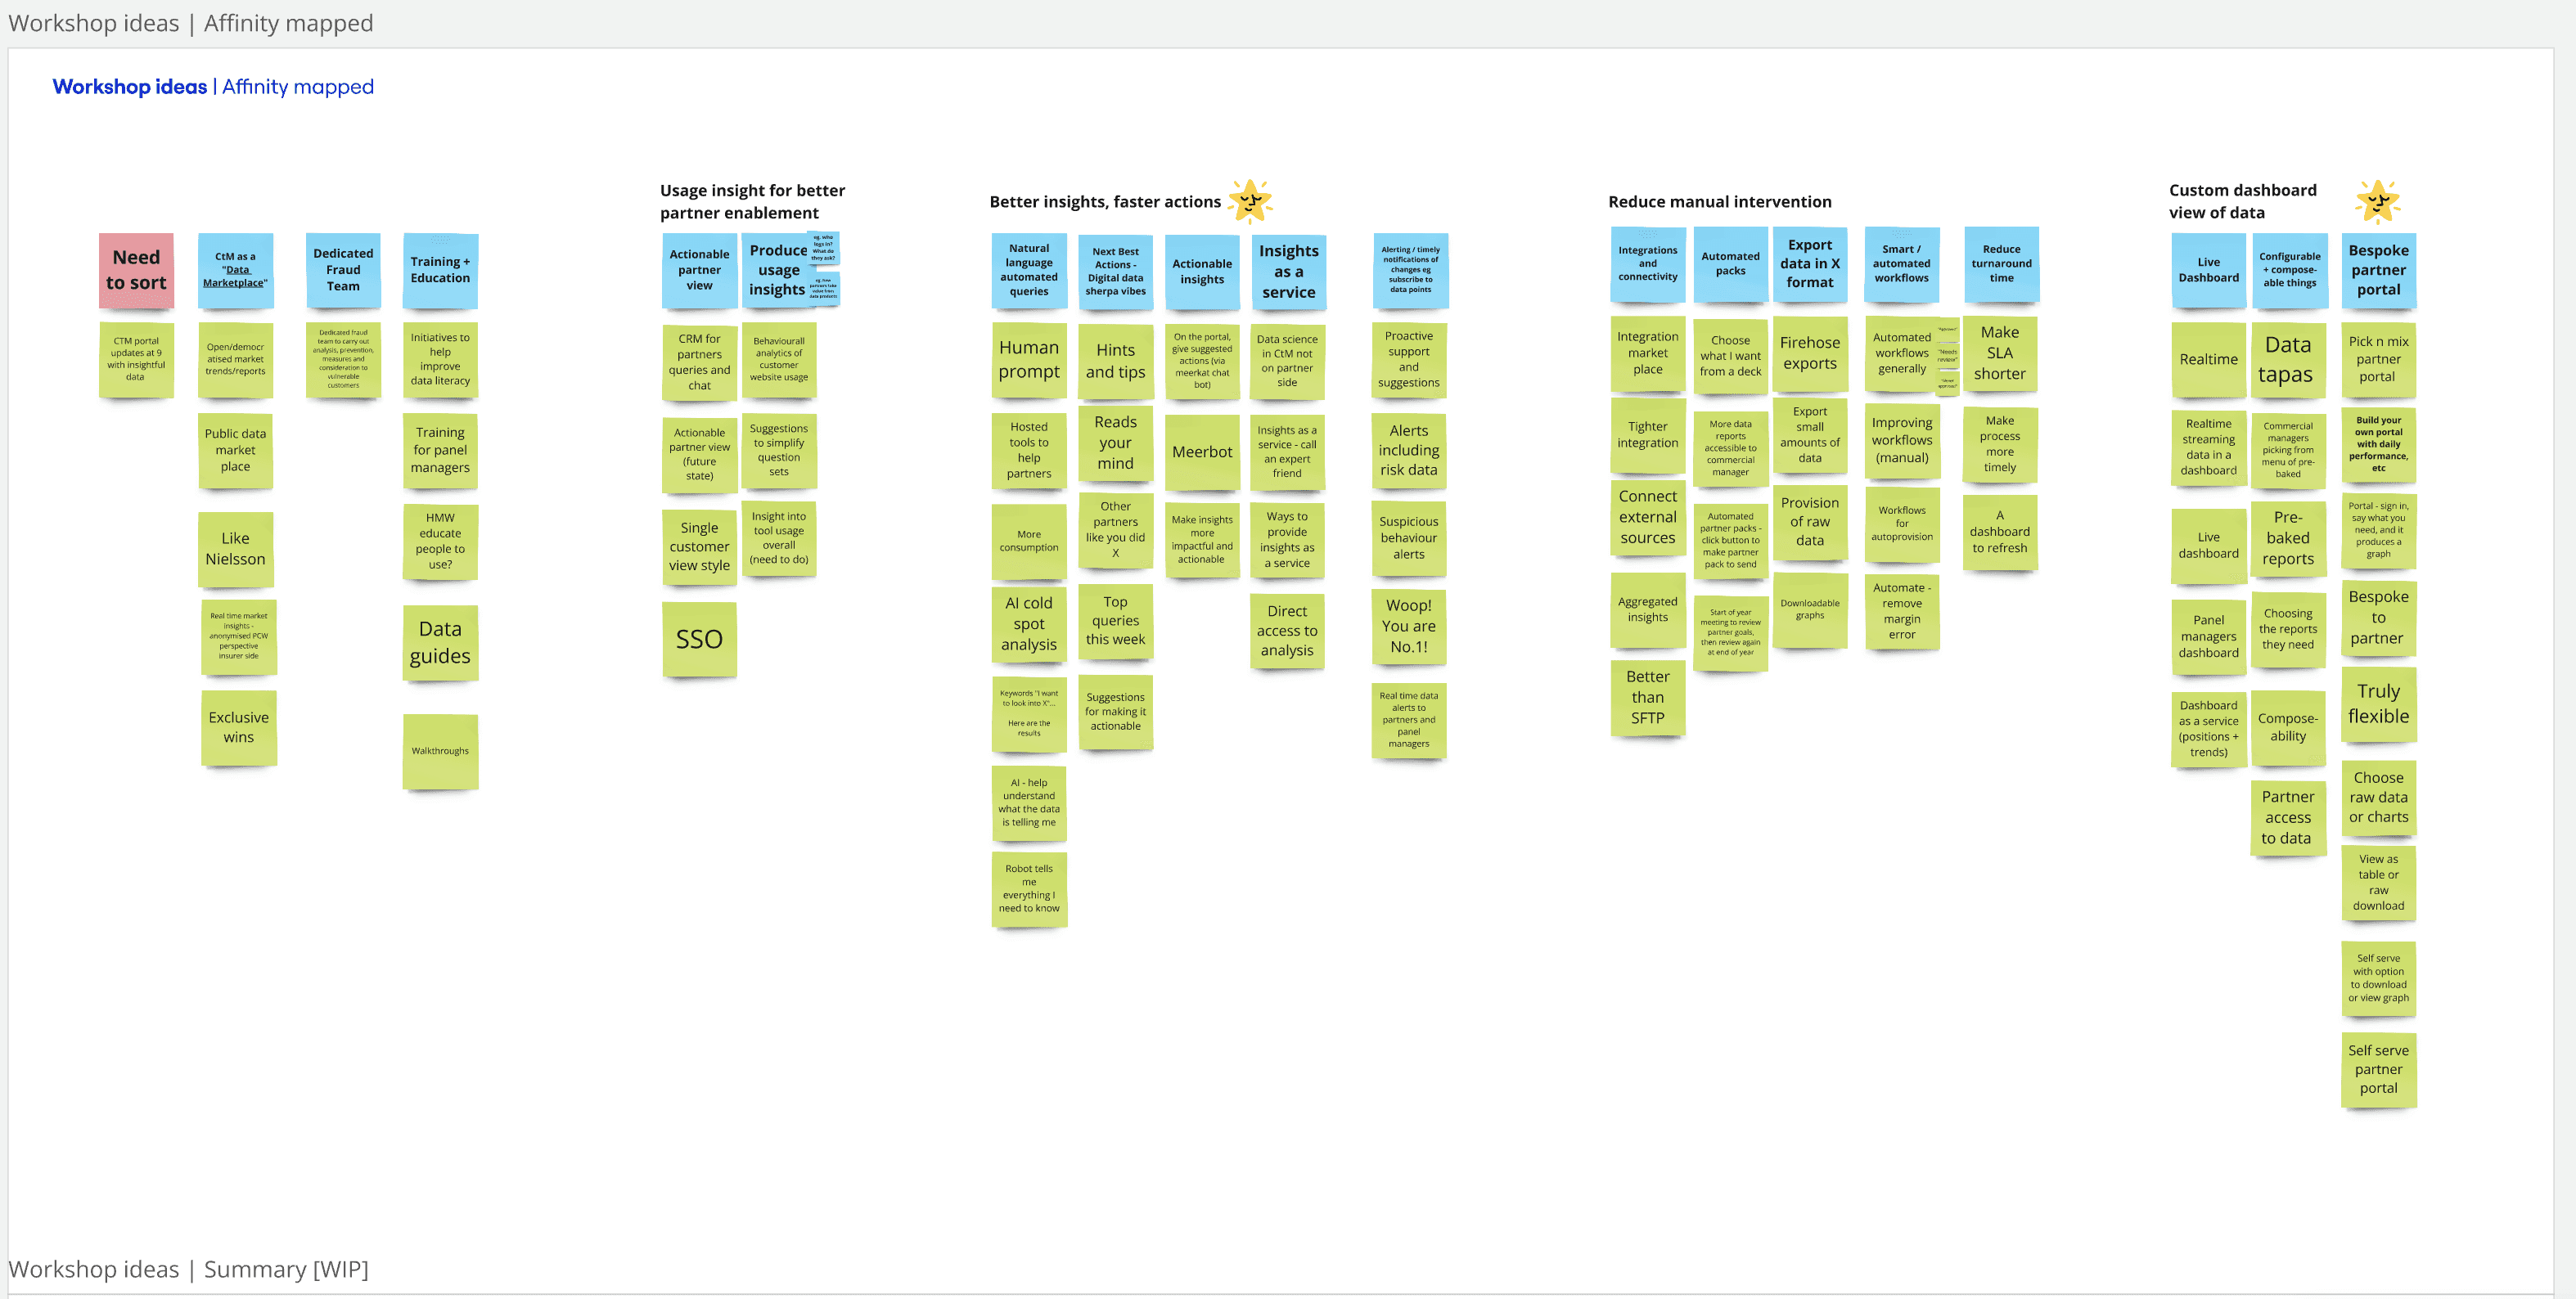
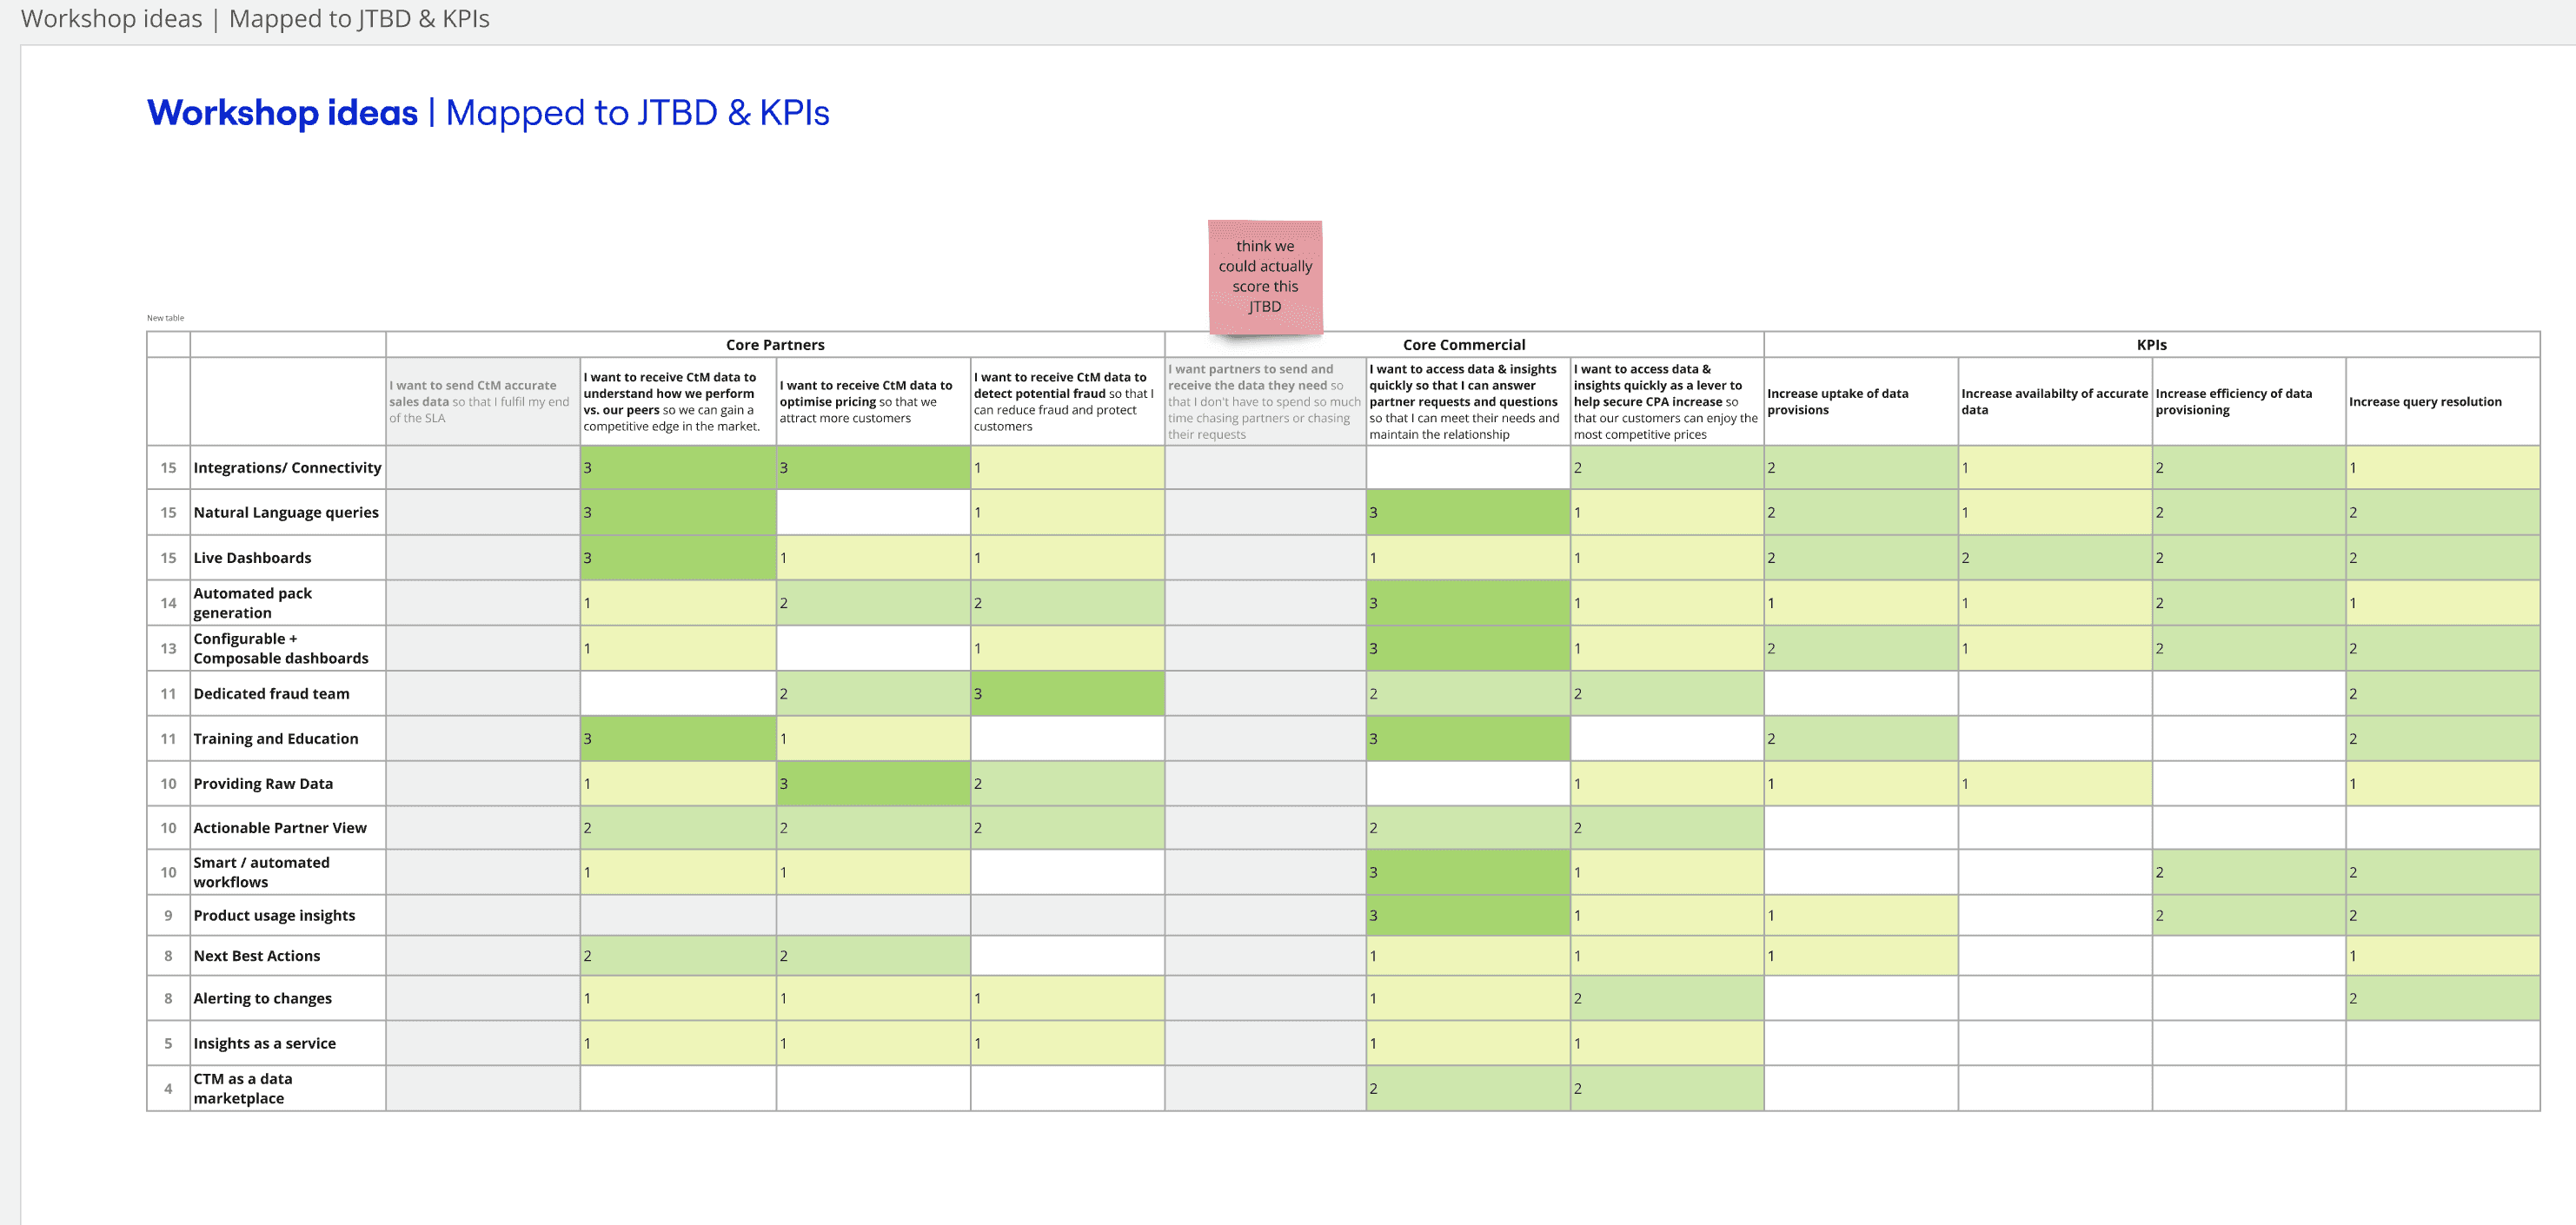
Prioritisation
The workshop generated a wealth of ideas aimed at solving our personas' challenges while also exploring their goals. Our team then organized these ideas into themes, mapped them to our KPIs, and prioritized them—identifying quick-win opportunities as well as those with the potential to address multiple issues.
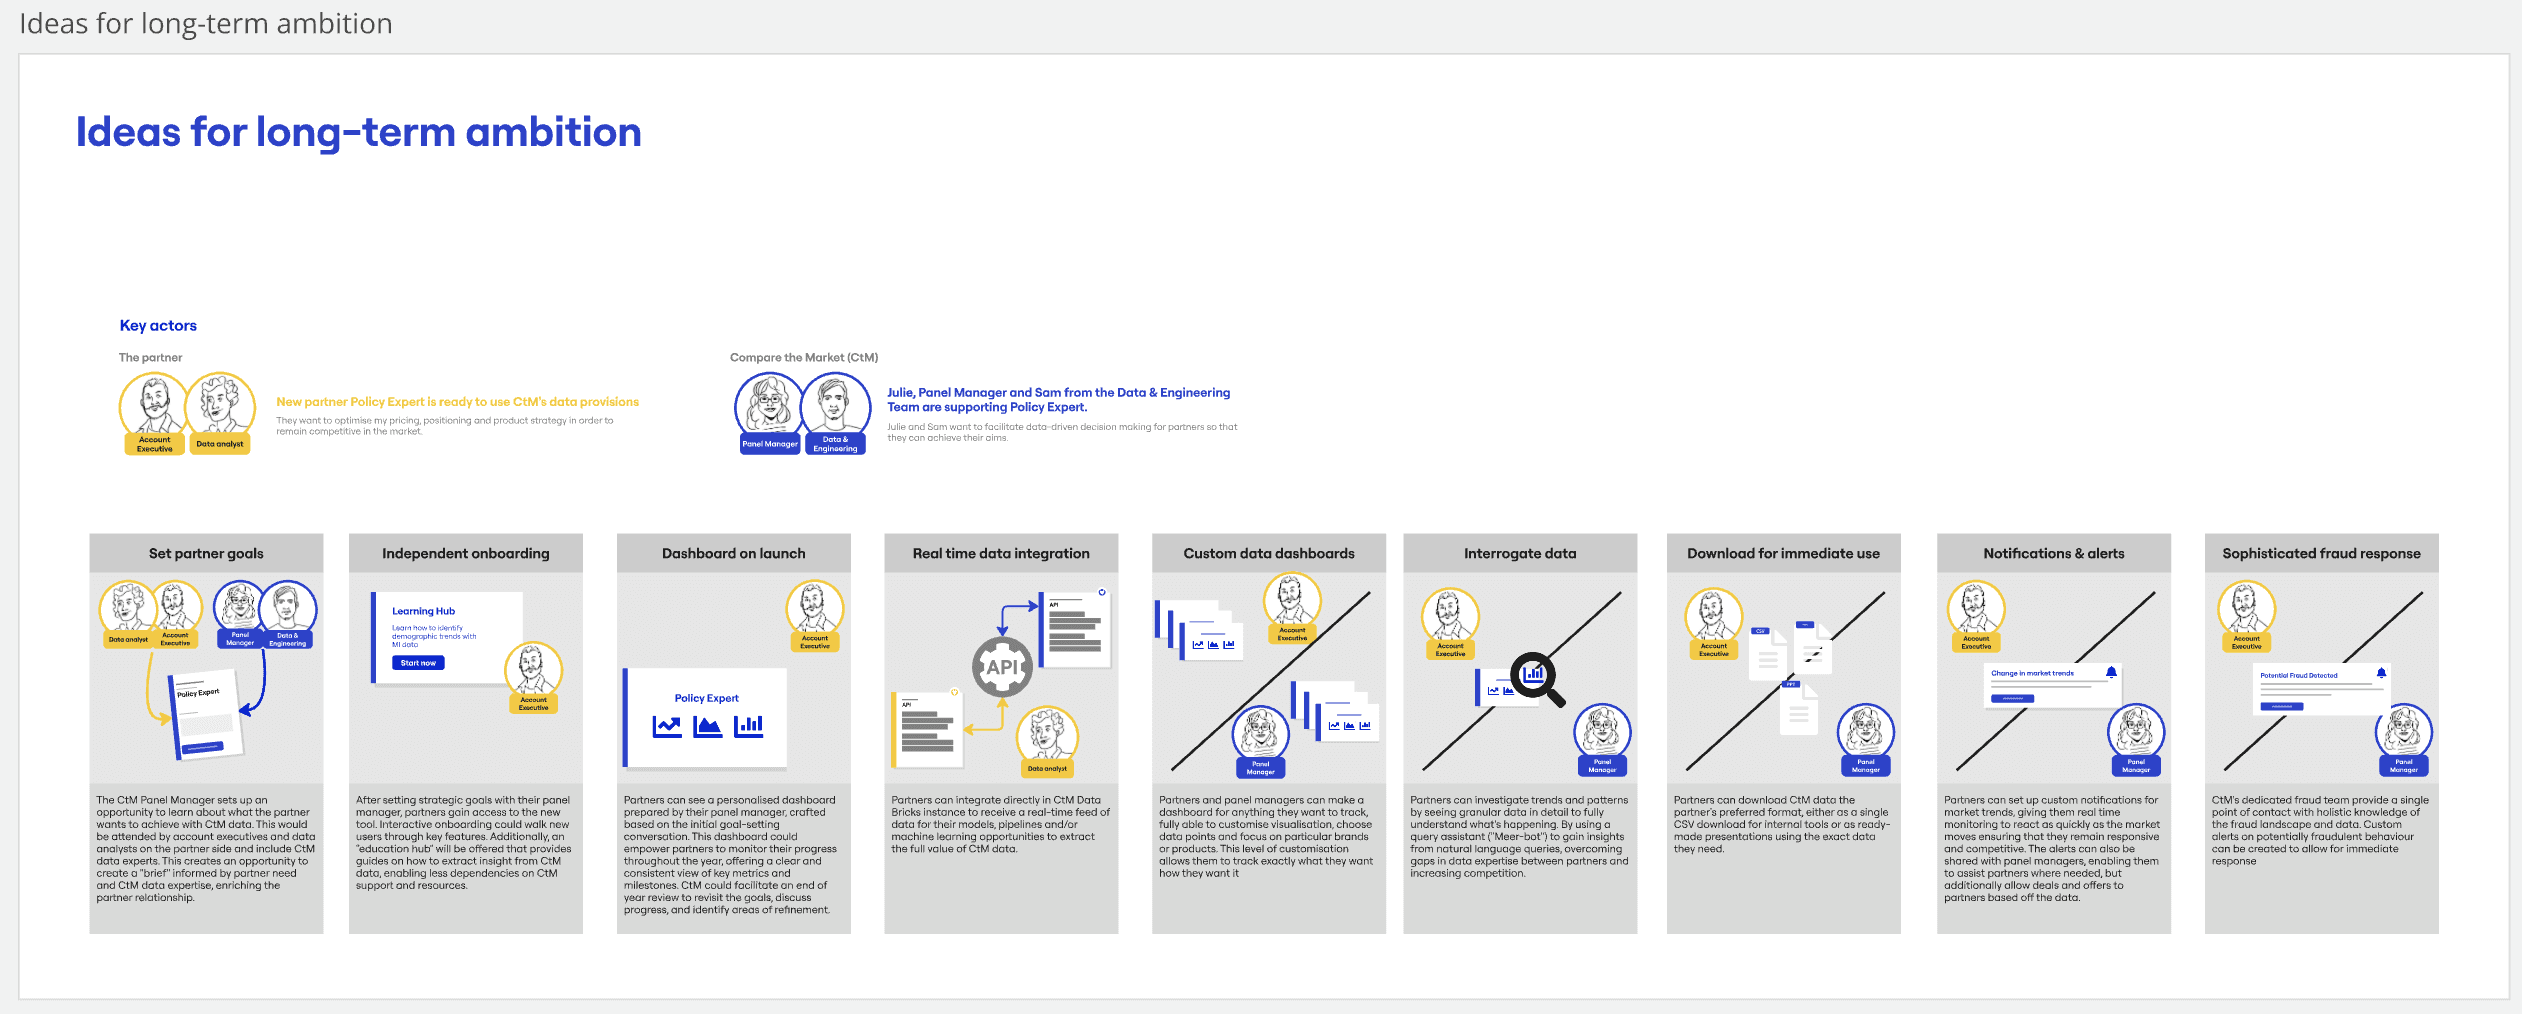
Storyboarding
Toward the end of the project, our team produced a storyboard. The storyboard served as a narrative tool, illustrating how the project might evolve over time by bringing these ideas to life. It provided a tangible vision of the future, helping to align stakeholders on a shared direction and highlight opportunities for innovation. By mapping out potential user experiences and system interactions, we were able to ensure that long-term goals remain at the forefront as the project progresses.
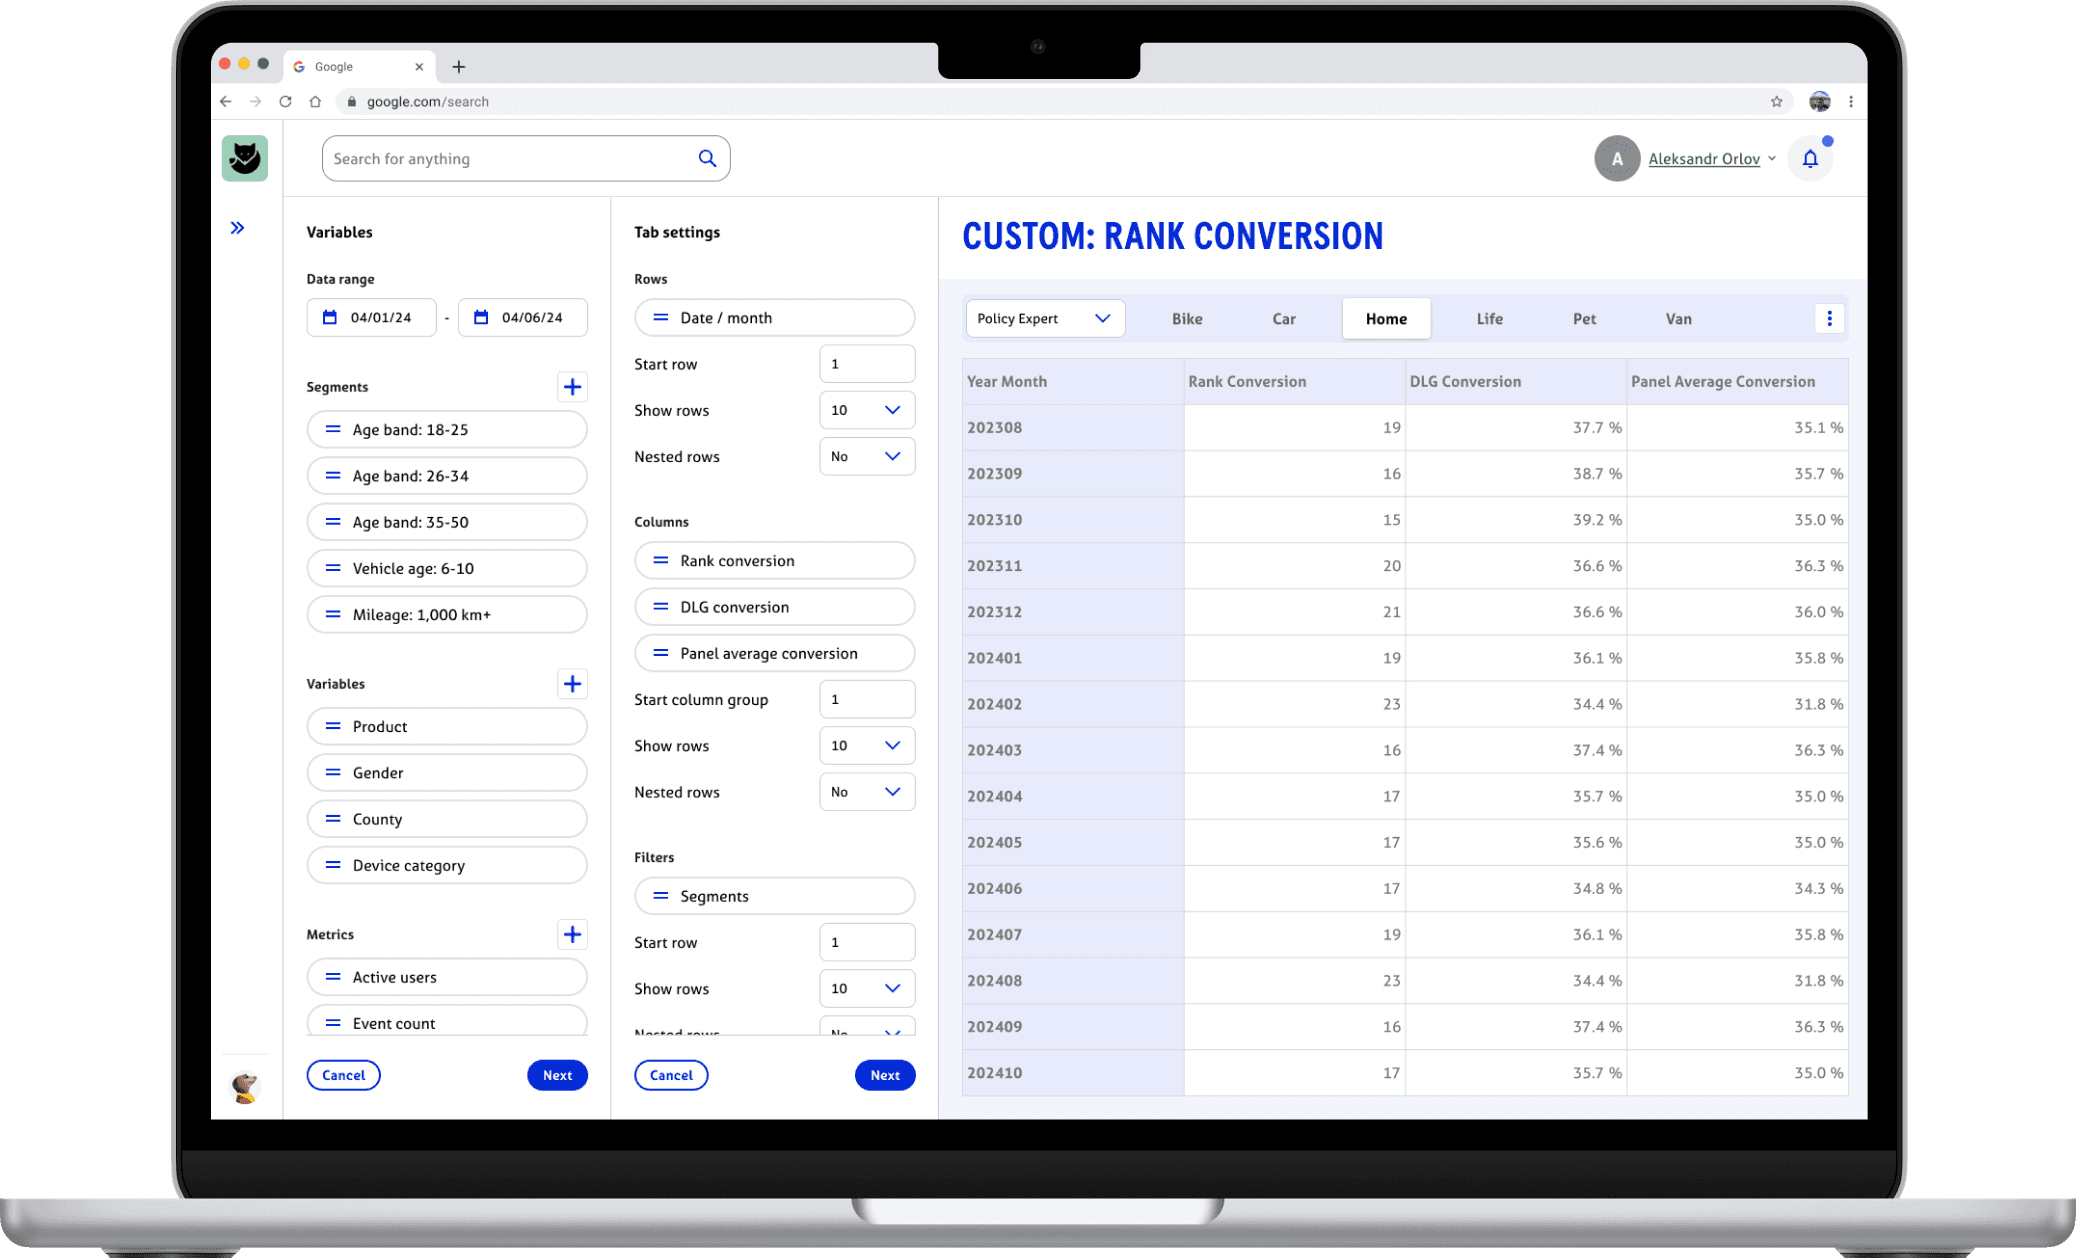
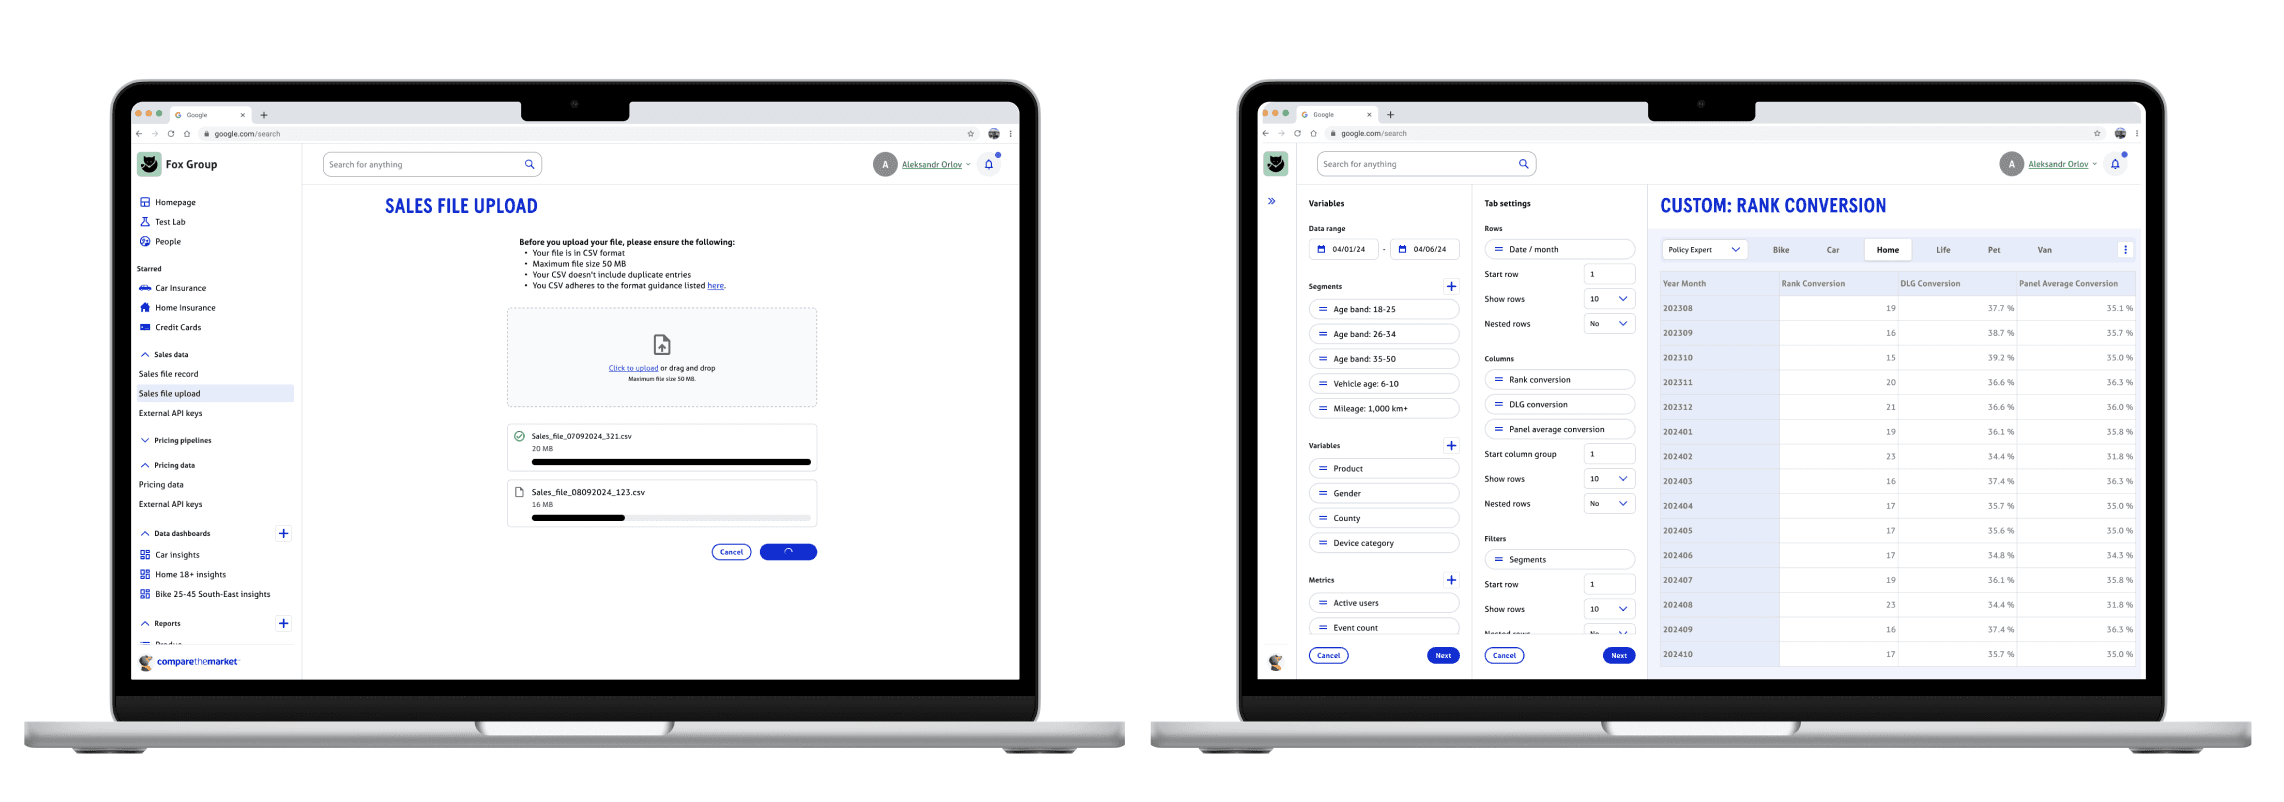
Mockups
Created visual of a new tool to illustrate the long-term vision, helping stakeholders better understand and align on the proposed improvements.
Conclusion
Working on the 'Everything Data' project for Compare the Market (CtM) was one of the most fast-paced and demanding engagements I’ve had as a UX designer. The accelerated timeline, combined with the scale and complexity of the problem space, provided valuable lessons in balancing research depth with practical delivery and navigating shifting priorities in a large organisation.
Key Takeaways
This project underscored the value of:
Strategic Planning for Research: Structuring research timelines to allow for analysis and synthesis without sacrificing quality.
Collaboration Across Disciplines: Working closely with product managers, engineers, and stakeholders to align on technical feasibility and business needs early.
Agility in Design: Being prepared to pivot based on new insights or priorities without losing sight of the overarching vision.
Balancing Strategy and Execution: Addressing immediate technical constraints while laying the groundwork for future innovation.
Final Thoughts